
Here’s a fun way for kids to track the weather and sneak in some math! Have them color a weather tree this month, with each color representing a different kind of weather.
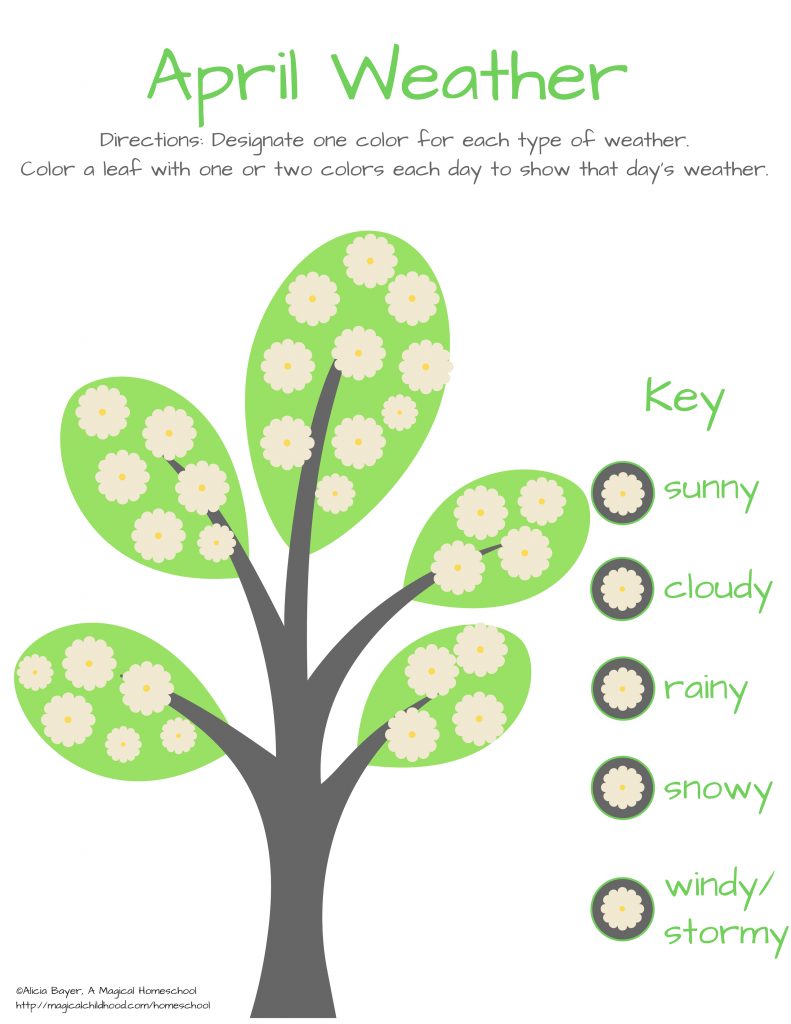
I make up a weather tree for each issue of Wild Kids Magazine, a free monthly nature magazine for kids and their grown ups. This month, I decided to use flowers instead of leaves since lots of trees will be blooming soon!
Weather trees are a great way for kids to visualize math, patterns and weather. They are basically a creative kind of a chart, letting folks see numbers and patterns at a glance.
As the month progresses, you can easily see what type of weather has been most common for the month. If the kids start coloring at the bottom left branch and work their way clockwise, they can also see patterns as the month progresses. Did the month start out with one kind of weather and change as it progressed? Were there clusters of one kind of weather?
You can download the weather tree (PDF) here: April Weather Tree
Here are some extensions to do for fun, working in math concepts like ratios, fractions and odds:
- Have the kids guess at the start of the month how many of each color their trees will have and then see how close they are at the end. Who guessed closest? How much were they off by? Were there any surprises?
- What color was most common? What was least? What was the difference between them?
- How many times more common was the most common weather type than the others?
- Ask the kids what they’d count as “good” and “bad” weather (sunny versus everything else? sunny and cloudy versus everything else? something else?). What was the ratio of good to bad weather?
- Look up the history of snowfall in your area in April. Has it ever happened? What are the odds of it happening?
- If they kept a weather tree for other months, how did it compare with this month?
You can also talk with the kids about the meanings of mean (average), median, mode and range. They are defined as:
The mean is also called the average. To get this number, add up all the numbers and divide by how many numbers are in the list.
If you have 12 sunny days, 10 cloudy days, 4 rainy days, 4 stormy days and 0 snowy days, you would add 12+10+4+4+0 to get 30 (30 days) and divide by 5 (5 kinds of weather) and you would expect an average of 6 days of each kind of weather. The average number of any kind of weather would be 6.
Obviously, the average is not going to be very helpful for this kind of thing, since we can probably expect more of some kinds of weather than others.
The median is the number directly in the middle if you put the numbers in numerical order. In this case, it would be 12, 10, 4, 4, 0, so the median number would be 4. Is this better for representing how common different types of weather were?
The mode is the number that appears most often in the list. In this case, our numbers are 12, 10, 4, 4 and 0, so the mode is also 4.
The range is the difference between the lowest and highest number. In this case, the range would be 12-0, so 12.
Talk to the kids about which method does the best job of showing how the weather acted this month. When would one kind be better than another? Can they think of what situations would make each one work best (for instance, if the weather was 30 sunny days and 0 of anything else, which way would work best?).
Of course, the kids can also just have fun coloring their trees. 😉
Have a great month!